With the first test with the First cars, I improved the code to facilitate the tests and detect possible sensor failures, today I tested with Carrera GO.
The test circuit:
a straight line composed of 9 “C” rails 342mm + the starting rail, 180° turn with 2 “G” rails and straight line then turn around.
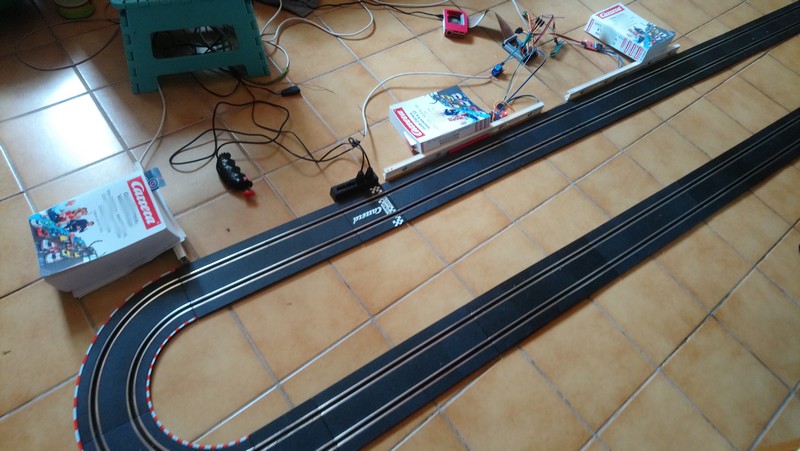
about 40cm after the start of the straight line we find the measuring device with measurements spaced: 10cm then 20cm, 10cm, 20cm, 10cm, 20cm and 10cm
distance between the 1st and the 8th = 1m
List of vehicles selected for this test, I tried to take vehicles of different categories:
| Référence | Désignation |
| 61037 | MarioKart – Mario |
| 61169 | Volkswagen Race Tuareg 2 Rally Dakar 2009 |
| 61178 | F1 Renault R30 Showcar 2010 |
| 61195 | Finn Mcmissile |
| 61268 | Mario Kart 7 – Yoshi |
| 61274 | AMG Mercedes C-Coupe DTM Jamie Green, No.5 |
Test 1: standing start, turbo start controlled by a relay controlled by the PC. turbo cut when passing the last sensor at 1m.
Test 2: we place a 9th sensor at the very beginning of the straight line at the very end of the bend. Launched start from the opposite straight line, we pass the bend and the sensor at the end of the bend activates the turbo relay. About 40cm further we pass on the 8 sensor device. Arrived at the last sensor the turbo cuts.
For test 1, I decided to make a new measurement out of curiosity, I call this its braking capacity. That is to say that at the last sensor the power supply is completely cut off. I will therefore measure the stopping distance, that is between the last sensor and the stopping of the car.
Each test will be carried out 3 times to validate the data and eliminate possible false measurements.
I tested 5 cars but I will only post the results of one car, 61274: AMG Mercedes C-Coupe DTM Jamie Green, No.5
Test 1 standing start
here are the curves of the 3 tests
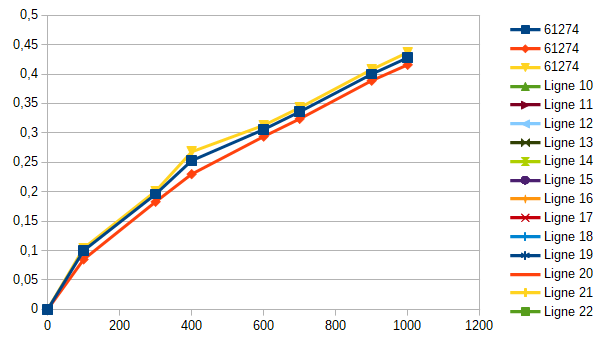
We see that the 3 curves are very close in the trend
I take the average of the 3 curves and now I look at its trend from a mathematical point of view
Let’s see if it’s rather linear?
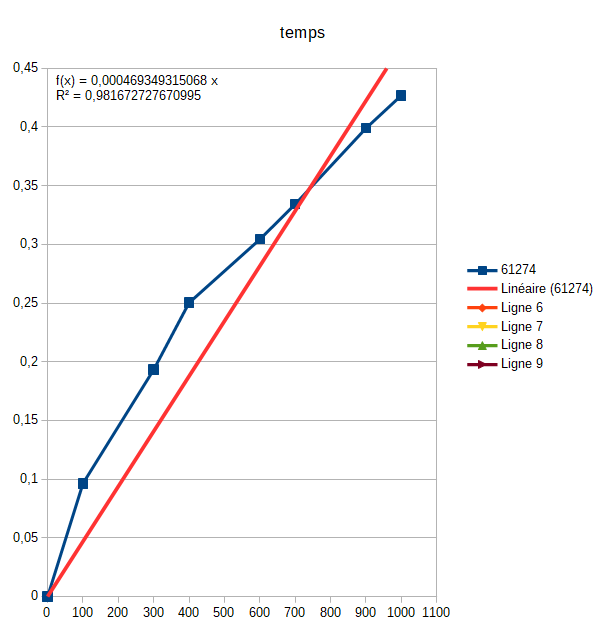
Not really, so logarithmic?
degree 2:
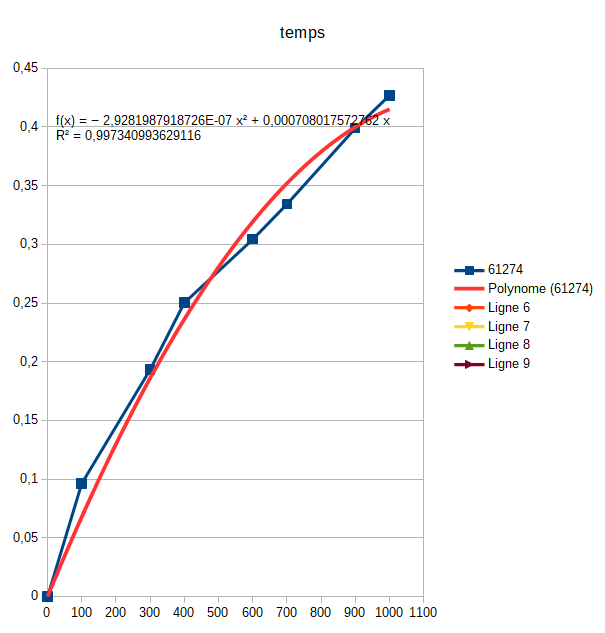
better, the coefficient of determination R2 is better (ideally equal to 1)
degree 3:
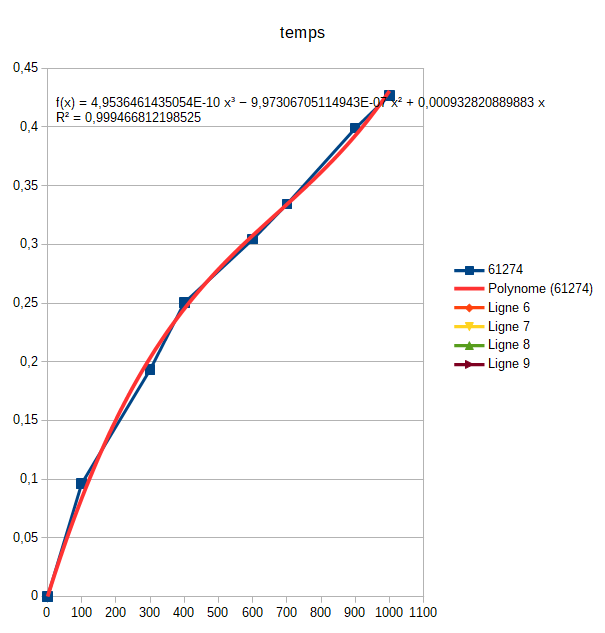
We’re not bad
I did level 4 but the gain is very minimal
for info the stopping distance is 88cm, but I will do a recap post on this point soon. on the 5 cars it goes from 88cm to 187cm!
Test results 2: rolling start
for each section, we calculate the speed
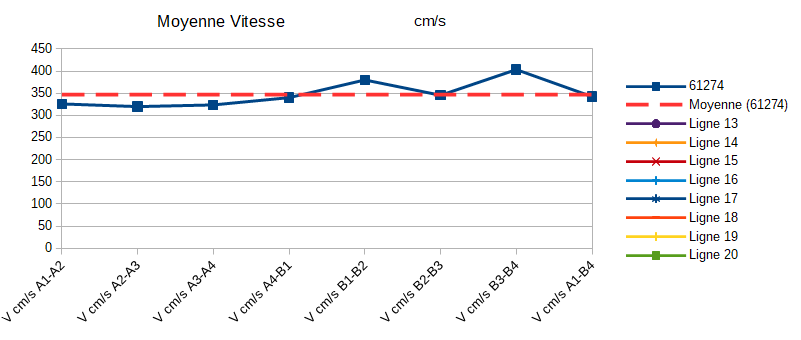
it’s pretty constant
If we display the time as a function of the distance during the 1m:
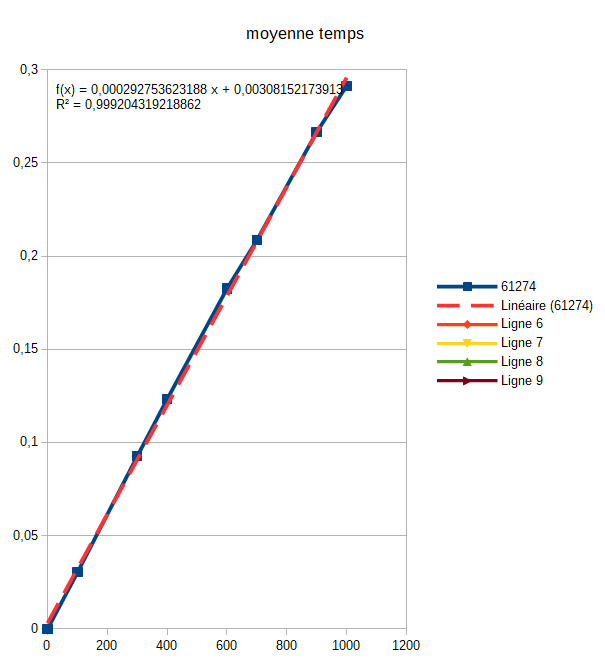
LThe linear trend curve displays a nice R2 of 0.999 which is very good
Summary:
From a standing start, we have the impression that in about 50cm we arrive at almost the maximum speed. The 1m is swallowed in less than 0.5 seconds
From a rolling start, there is not much variation in speed. The 1m is swallowed in less than 0.3 seconds
Here are the curves of the 5 cars in 1m from a standing start
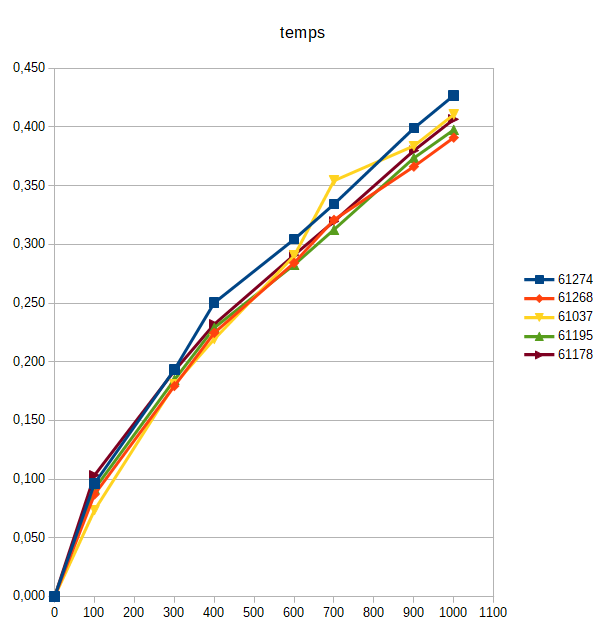
In the table below on the left the test data and on the right the calculation result.
There is the calculation of the acceleration from a standing start over 1m. Then thanks to the distance traveled after cutting the power supply, I calculated the deceleration (or natural braking).
I calculated for information the braking ratio compared to the acceleration (balance)
Out of curiosity I also calculated the kinetic energy which has mass and speed as parameters to see if there is a link. Nothing obvious on the graphs. Not enough measurements for someone who says there is no link as if to say that there is a possible link.
| unité | s | cm/s | g | cm | cm/s | Joules (J) | m/s² | g | m/s² | g | % | |
| Ref véhicule | Time for 1m | Speed at 1m | mass | stopping distance | Launched speed | Kinetic energy at 1m | Acceleration over 1m | Acceleration over 1m in G | Deceleration | Deceleration in G | Brake/accelerator balance | |
| 61037 | 0,411 | 374 | 40 | 114 | 404 | 0,280 | 9,100 | 0,928 | 6,135 | 0,625 | 67% | |
| 61169 | 0,414 | 388 | 44 | 187 | 422 | 0,331 | 9,372 | 0,955 | 4,025 | 0,410 | 43% | |
| 61178 | 0,407 | 375 | 33 | 97 | 391 | 0,232 | 9,214 | 0,939 | 7,249 | 0,739 | 79% | |
| 61183 | 0,46 | 348 | 50 | 129 | non testé | 0,303 | 7,565 | 0,771 | 4,694 | 0,478 | 62% | |
| 61195 | 0,397 | 410 | 33 | 104 | 420 | 0,277 | 10,327 | 1,053 | 8,082 | 0,824 | 78% | |
| 61268 | 0,391 | 404 | 34 | 112 | 442 | 0,277 | 10,332 | 1,053 | 7,286 | 0,743 | 71% | |
| 61274 | 0,425 | 360 | 44 | 88 | 400 | 0,285 | 8,471 | 0,863 | 7,364 | 0,751 | 87% |
Accélération / décélération graph :
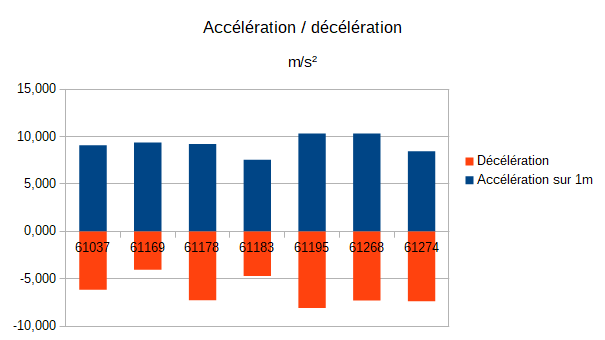
Next step:
have more data.
Technically I still have connectors on the computer to add a third ramp, I have to order the module from Ali!
Refine the detection on some sensors, I think some are not aligned like the others. On some sectors, this explains variations.
Look for new test ideas.